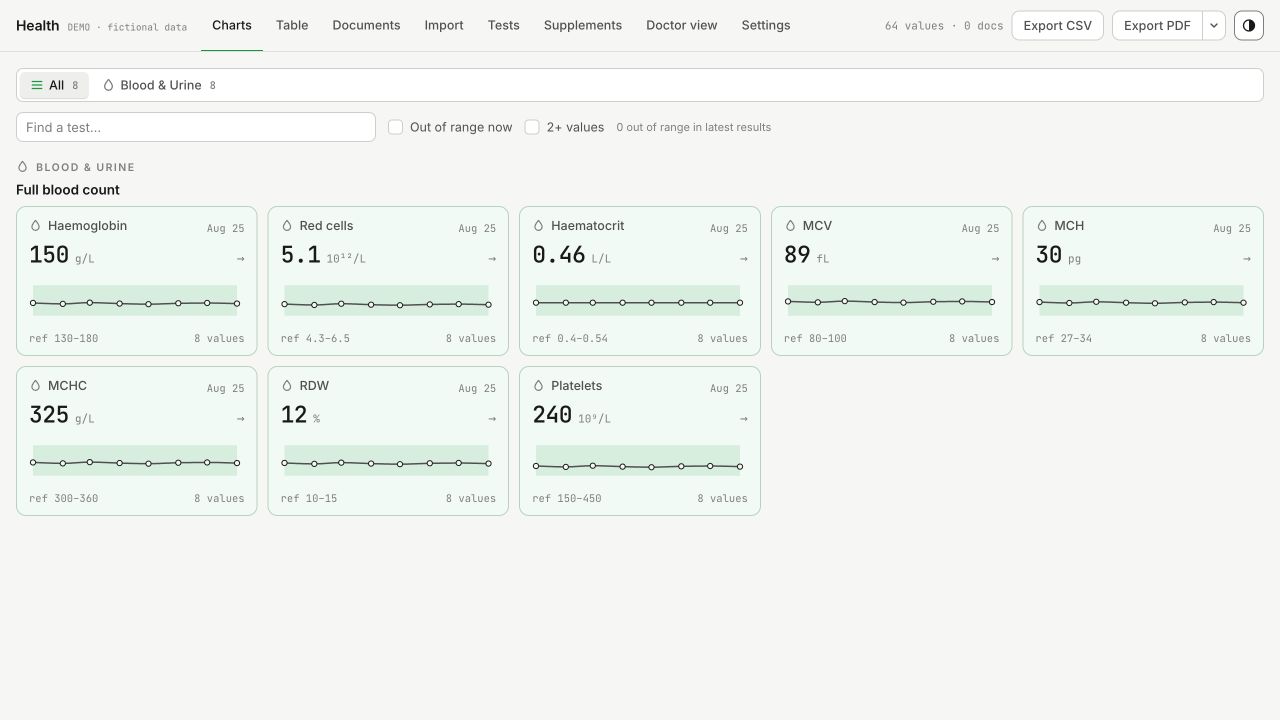
Every Test Result in One Place
A private health records app that turns lab reports into charted values against their reference ranges, keeps every number linked to its source PDF, and gives a doctor a clean view on an iPad.
The problem
Medical results arrive as PDFs. Different labs, different layouts, different units, years apart. Each one makes sense on the day it arrives and almost none of them make sense together.
The questions that actually matter are about change. Is this value drifting, and since when. Was it out of range before, or only this time. What did the eye test say three years ago. Answering any of those means opening a folder of PDFs, finding the right page, and comparing numbers that may not even be in the same unit.
So the goal was one place where every result lives as a value with a date, a unit and a reference range, and where the original document is always one click away.
The PDF stays the source of truth
The first decision was about trust. A chart is only as good as the number behind it, and a number copied from a PDF can be copied wrong.
So every value keeps a link back to the report it came from. If a point on a chart looks odd, the source is right there, and the question of whether the lab or the import got it wrong takes seconds to answer. The original files stay in their own folder structure, organised by type: blood and urine, imaging, eye, hearing, dermatology, allergy, cardiovascular. The app sits alongside that structure rather than replacing it.
Results come in by PDF or CSV import, with a review step before anything is saved. Text is extracted in the browser; scans and photographs can go through OCR. Matching and unit conversion suggest an interpretation, but uncertain rows need checking. The table stays editable, because some reports will always need a human to tidy them up.
Ranges, units and flags
Every lab prints its own reference range, and some change their units between reports. The app keeps the range attached to each result and converts supported units to the test’s canonical unit. Unsupported conversions are marked for review rather than silently accepted. That makes comparisons easier to inspect, while keeping the lab report available for context.
Values outside their range are flagged, quietly. The intent is to make a pattern visible, not to raise an alarm about a single reading, which is a conversation for a doctor rather than a chart.
Charts are grouped by category, so related markers sit together and a trend across a panel reads at a glance.
Not just blood tests
Lab panels are the obvious case, but they are not the only numbers worth following over time. Eye prescriptions per eye, hearing tests, skin-check findings and imported allergy results can be difficult to follow across separate documents. Numeric measurements sit on charts; findings without numbers stay attached to documents in the same archive.
Everyday data needs a different chart
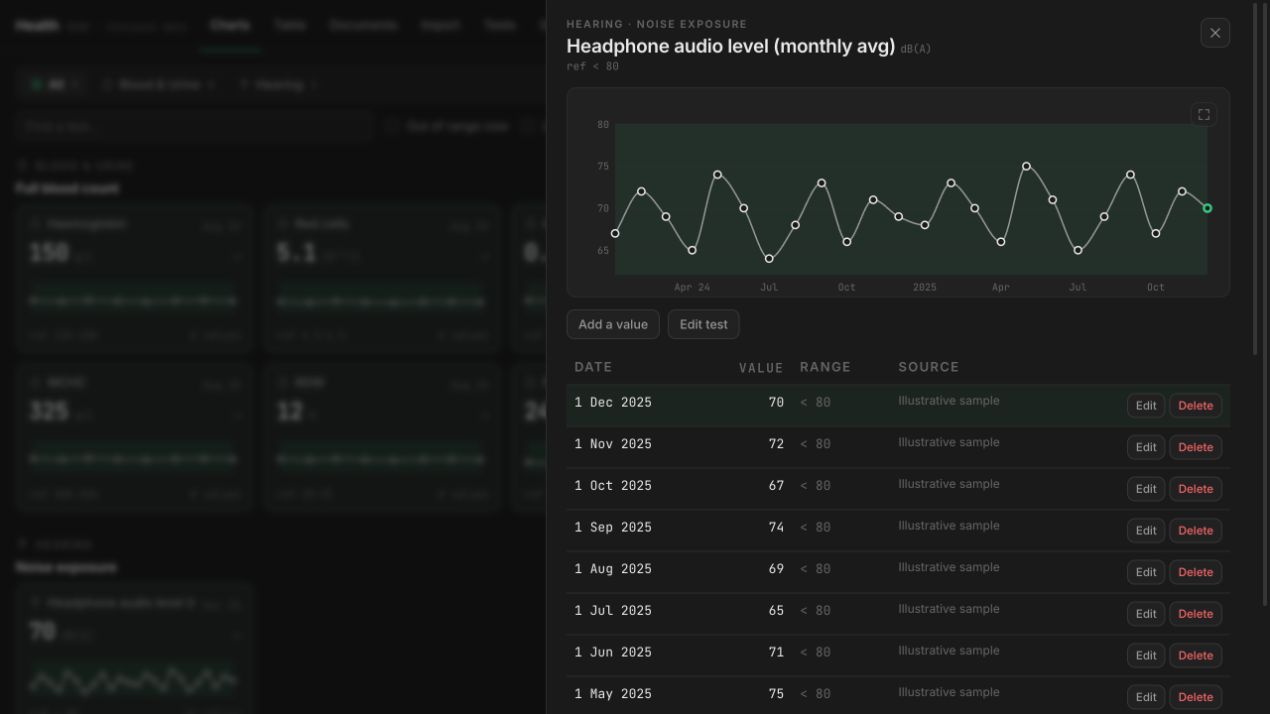
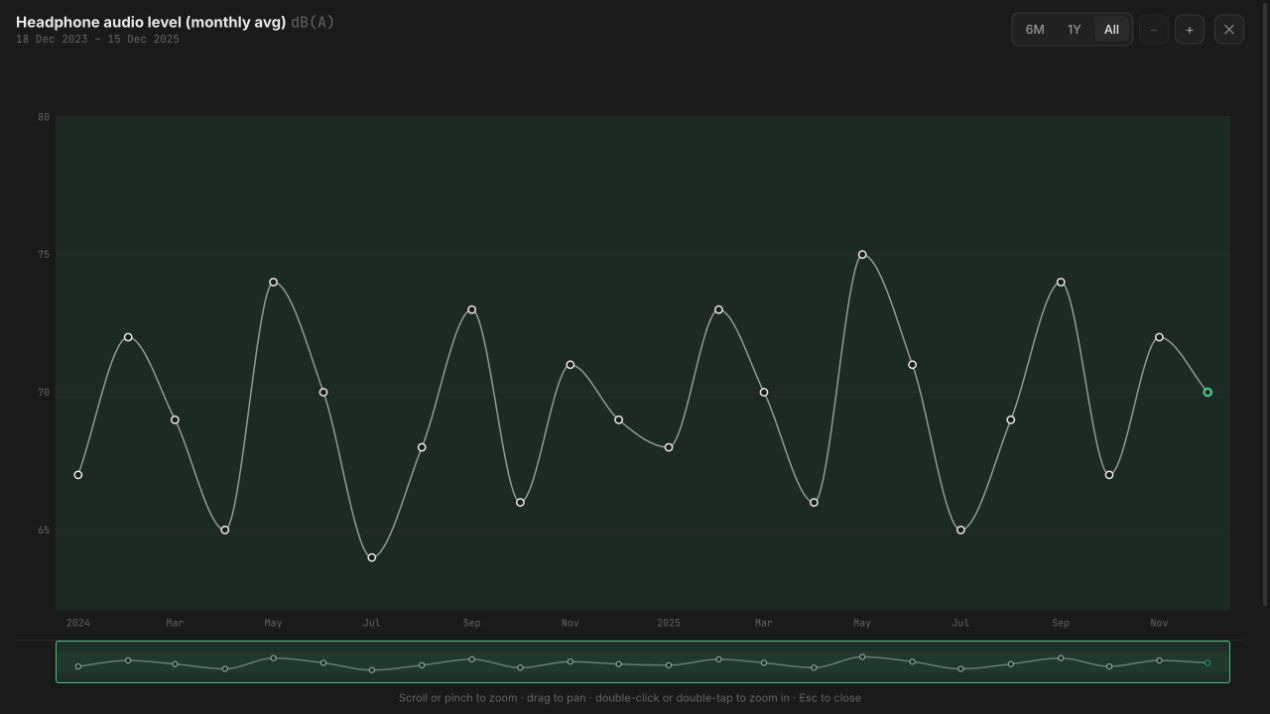
Apple Health imports extend the timeline beyond occasional lab visits. Dense daily data, such as weight, needs a different treatment from a handful of blood tests. The app draws sparse measurements through their recorded values and offers a fixed time-window trend for dense series. Monthly totals and averages remain monthly observations.
A chart can open full screen, with zoom, pan and an overview strip. The recorded points remain visible so a smooth line does not hide what was actually measured.
The doctor view
The most useful moment for this data is ten minutes in a consulting room. So there is a doctor view designed for an iPad: the relevant charts, clean and readable, with nothing to explain. It is easier to hand someone a tablet than to scroll through a phone while they wait.
Export goes the other way: a standard or doctor-summary PDF, or a CSV of the recorded values, for a specialist, a referral or a second opinion.
Private by design
This is the most personal data I have, so the defaults are strict. The app sits behind Cloudflare Access, so nothing loads at all without signing in, and it deploys from git to Cloudflare. The records themselves never go into the repository. The screenshots on this page were captured from a separate local preview of the interface using entirely fictional data. No personal readings, source reports or patient details were included.
The same rule applies here as in my other personal tools: if it would be uncomfortable to find it in a public repo, it does not go into one.
What it does
A private, single-user health records app. PDF and CSV import, charts by category against each result’s own reference range, unit conversion, out-of-range flags, and an editable results table. Every value links to its source PDF. Eye, hearing, skin and allergy results are tracked over time alongside lab panels. A doctor view for the iPad and PDF or CSV export for sharing. Sign-in through Cloudflare Access.